Is NVDA a Buy Now? Stock Price Prediction & 2026 Forecast

Last Updated: December 18, 2025 | Next Update: December 22, 2025
💡 Should You Buy NVDA Stock?
For Growth Strategy: ✅ High Alignment
NVDA offers dominant AI exposure suitable for 3-5 year horizons. However, technical indicators suggest waiting for pullbacks to improve entry pricing.
For Conservative Strategy: ❌ Low Alignment
High volatility (Beta 1.68) and premium valuation (48x P/E) create downside risks that typically exceed stability-focused risk parameters.
For Active Trading: ⚠️ High Volatility Setup
Offers significant swing potential (20-30% range), demanding strict risk management and position sizing.
How Our Quantitative Model Analyzes NVDA
Our Quantitative Analysis Model - RockFlow Bobby processes 4 core signals based on live market data:
| Signal | What It Reveals | Why It Matters |
|---|---|---|
| 📰 | Earnings surprises, product launches, policy changes | Shows momentum direction and near-term drivers |
| 📊 | Revenue growth, profit margins, cash flow quality | Indicates business health and competitive strength |
| 💰 | P/E ratio, growth-adjusted metrics, peer comparison | Tells you if current price offers reasonable value |
| 📈 | Volatility patterns, momentum, entry timing | Helps assess risk-reward and position sizing |
🎯 NVDA Stock Price Prediction & 2026 Forecast
RockFlow Model Forecast: 3 Scenarios for 2026
We audit Wall Street's consensus using our proprietary Quantitative Model, stress-testing analyst optimism against fundamental data to identify potential valuation divergences. Instead of a single prediction, we project three probability-weighted scenarios to account for market uncertainty. Our model aligns closest with the Base Case (155−170), suggesting limited upside potential compared to Wall Street's aggressive $175 target.
| Scenario | Probability | Price Target | Key Assumptions |
|---|---|---|---|
| 🟢 | 20% | [object Object] | AI spending accelerates; Gross Margins stay >75%; No new China bans |
| 🟡 | 50% | [object Object] | Growth normalizes to 30%; Margins stabilize at 73%; Competition rises slightly |
| 🔴 | 30% | [object Object] | Regulatory headwinds intensify; Margins drop <70%; Tech spending slows |
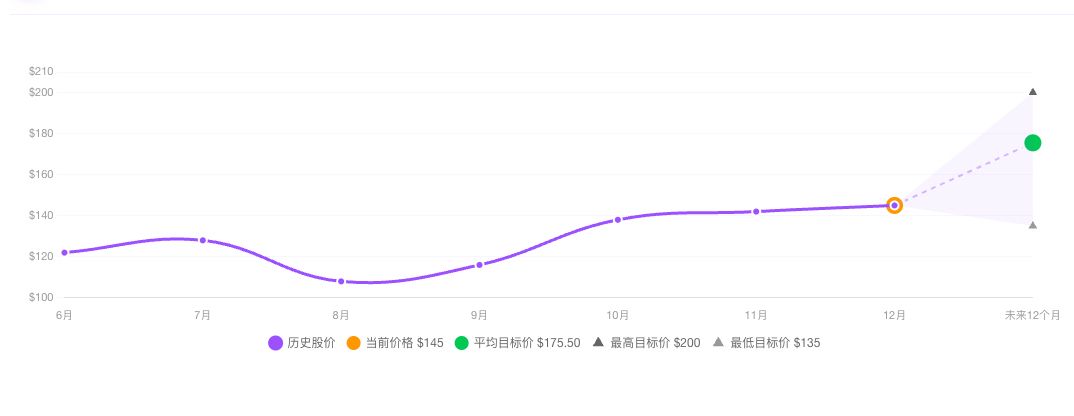
Wall Street Consensus
| Metric | Value | What It Assumes |
|---|---|---|
| [object Object] | $175.50 | AI spending grows 50%+ annually |
| [object Object] | +21% | Current momentum continues through 2025 |
| [object Object] | 42 analysts | Broad coverage, institutional focus |
| [object Object] | $135 - $200 | $65 spread shows uncertainty |
| [object Object] | 83% Buy, 14% Hold, 3% Sell | Overwhelming bullish sentiment |
📰 Signal 1: Recent NVDA Catalysts
NVDA beat Q3 earnings with $35.1B revenue (8% above estimates), and accelerated Blackwell chip delivery to Q1. However, China export restrictions threaten $5-7B in revenue, and gross margins declined from 78% to 75% over two quarters as competition intensifies.
| ✅ Positive Catalysts | ⚠️ Concerns to Watch |
|---|---|
| — Revenue $35.1B vs $32.5B est (+8% surprise) | — $5-7B revenue at risk from export bans |
| — Next-gen chips shipping Q1 vs Q2 timeline | — Dropped from 78% to 75% over 2 quarters |
| — Multi-year deals through 2026-2027 | — MI300X winning datacenter deals |
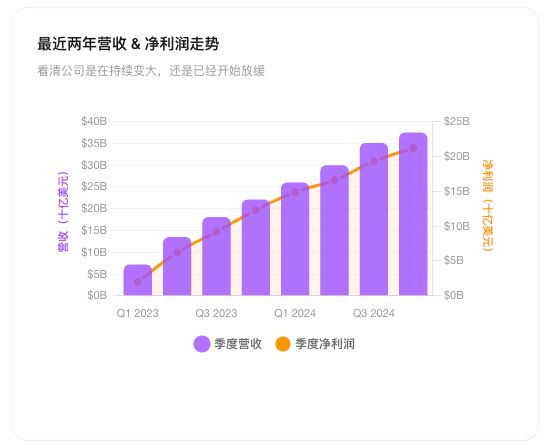
📊 Signal 2: NVDA Fundamental Performance
NVDA's revenue nearly doubled year-over-year to $35.1B, driven entirely by datacenter (87% of revenue). While gross margins remain industry-leading at 75%, the decline from 78% signals rising competitive pressure. Free cash flow of $16.3B provides runway for R&D investments.
| Metric | Value | Context |
|---|---|---|
| [object Object] | $35.1B | Nearly 2x last year's $18.1B |
| [object Object] | +94% | Datacenter (87%) driving all growth |
| [object Object] | 75.1% | Down from 78%; vs Intel 42%, AMD 53% |
| [object Object] | $16.3B | Healthy cushion for R&D |
| [object Object] | 87% of revenue | AI training/inference chips |
| [object Object] | 10% of revenue | GPU sales recovering |
| [object Object] | 3% of revenue | Professional visualization, automotive |
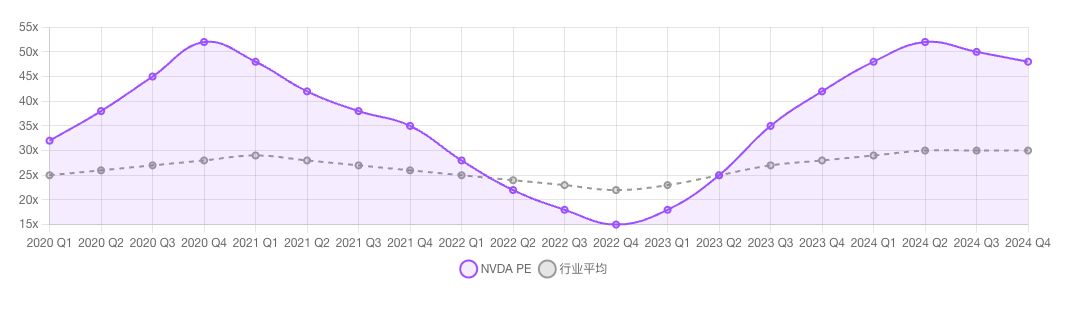
💰 Signal 3: NVDA Valuation Assessment
At 48x earnings, NVDA trades at a 60% premium to semiconductor peers. However, the PEG ratio of 0.96 suggests growth justifies the valuation. The key risk: if growth slows to 30%, the stock could revalue to $110-$120 even with solid fundamentals.
| Metric | NVDA | Industry Avg | Premium | What It Means |
|---|---|---|---|---|
| [object Object] | 48.2x | 30.2x | +60% | Paying premium for growth |
| [object Object] | 0.96 | ~1.5x | Actually lower | Growth justifies the premium |
| [object Object] | 22.8x | 6.5x | +251% | Reflects 75% gross margins |
| [object Object] | ~35x P/E | - | Stock → $110-120 | Valuation risk scenario |
📈 Signal 4: NVDA Technical Analysis & Risk Profile
NVDA's Beta of 1.68 means the stock amplifies market moves—gains and losses are 68% larger than the S&P 500. Currently trading at $145 near the 52-week high of $153, the stock has limited cushion after a +34% YTD run.
| Metric | Value | What It Means |
|---|---|---|
| [object Object] | 1.68 | Stock moves 68% more than market; amplifies gains AND losses |
| [object Object] | -18.2% | Even great companies see sharp corrections |
| [object Object] | $108 - $153 | Currently $145, near upper end |
| [object Object] | +34.3% | Outperformed S&P's +24%, but with higher volatility |
| [object Object] | 10% allocation = 16.8% exposure | Beta amplifies portfolio risk |
Get Personalized Price Predictions
Stop guessing. Get your personalized price predictions and real-time trading insights from RockFlow Bobby, your 24/7 AI Investment Partner. Bobby connects the dots across all data sources, so you can Chat your way to better trades. 👉 Sign Up & Claim Your $2 + Tesla Stock! 🚀
Risk Factors: What Could Go Wrong
The biggest risk is demand sustainability. Hyperscalers are spending $200B+ annually on AI infrastructure with uncertain returns—if AI commercialization disappoints, this spending will slow sharply. NVIDIA learned this in 2022 when crypto mining demand evaporated and revenue dropped 40% in two quarters. AI is more durable than crypto, but speculative investment can still disappear quickly.
Frequently Asked Questions
1. Is NVDA a good stock to buy? NVDA is a high-quality business with dominant market position (80%+ AI chip share) and 75% gross margins, suitable for growth investors with 3-5 year horizons. However, the 48x P/E valuation offers limited margin of safety, and high volatility (Beta 1.68) means 20-30% corrections are common. Consult a financial advisor to assess if NVDA aligns with your risk tolerance and investment goals. 2. Is NVDA stock overvalued or undervalued? At 48x forward earnings, NVDA trades at a 60% premium to semiconductor peers, but the PEG ratio of 0.96 suggests growth justifies the valuation. The stock is fairly valued if AI spending continues, but offers no safety margin if growth slows or competition intensifies. Your view depends on whether you believe AI infrastructure spending will sustain current rates. 3. What are the key risks of holding NVDA? The primary risk is demand sustainability—if AI spending slows, NVDA's 87% datacenter concentration makes it vulnerable (similar to 2022's crypto crash when revenue dropped 40%). Additional risks include China export restrictions ($5-7B at risk), rising AMD competition, and customer concentration (four companies = 40% of revenue). At 48x earnings, even modest growth deceleration could push the stock to $110-$120. 4. What is the NVDA stock forecast for 2026? Wall Street projects $175.50 average target (+21% upside), with a $135-$200 range depending on AI spending and competition. Long-term forecasts are uncertain and depend on sustained AI growth, NVDA maintaining 70%+ market share, and margins above 65%. Focus on quarterly fundamentals rather than specific price predictions, and consult financial advisors before making investment decisions.
🤖 About This Analysis
Methodology: This analysis combines quantitative financial data with qualitative assessment of competitive positioning, market dynamics, and risk factors. We evaluate NVDA through four key signals: recent catalysts, fundamental performance, valuation assessment, and technical risk profile.
Data Sources: SEC filings (10-K, 10-Q, 8-K), company earnings releases, Wall Street analyst reports, Bloomberg Terminal, FactSet financial data, verified against primary sources.
Update Frequency:
- Weekly: Price targets, technical indicators, analyst rating changes
- Quarterly: Fundamental metrics and guidance following earnings
- As-Needed: Material events, competitive developments, regulatory changes
Analysis Date: December 15, 2024, 4:00 PM EST
Next Scheduled Update: December 22, 2024
Disclaimers: This content is for informational purposes only and does not constitute investment, financial, legal, or tax advice. All investments carry risk of loss. Conduct your own research and consult a qualified financial advisor before making investment decisions. Forward-looking statements involve uncertainties; actual results may differ. We make no guarantees about accuracy or completeness of information provided.

