Alphabet Q3 2026 Earnings: Why GOOGL Fell 10% | RockFlow

RockFlow Shayne
October 30, 2026 · 16 min read
Key takeaways:
1)Revenue grew by 25%, yet the share price dropped by 10%. The problem with Google's third-quarter report lies in its overly rapid spending: search growth has slowed to 12%, capital expenditure for the single quarter exceeded 50 billion US dollars, free cash flow has been negative for two consecutive quarters, and investment will be significantly stepped up in 2027. For the first time, the market has lost patience with its AI cash-burning practices.
2)There is another side behind the decline. Its cloud business revenue doubled, with the profit margin rising to 36%; the $561 billion backlog orders have locked in future growth, TPUs have started generating external revenue, and the growth rate of search queries hit a five-year high. Google is currently at the bottom of the J-curve marked by "upfront investment followed by lagging returns", and its current stock price roughly reflects a neutral scenario.
3)RockFlow Investment Research holds that the optimal strategy at present is: long-term holders should hold their core positioning, and those intending to increase positions should build positions in three batches, taking the 2027 capital expenditure guidance announced in Q4 as the key verification point. This article is co-created by the investment research team and Bobby. Any of your opinions can be submitted to Bobby to generate a strategy, which can then be verified through backtesting.
A company's revenue grew by 25%, yet its share price fell by 10%.
After the market close on October 28, Google laid this conundrum before everyone. When it comes to making money, it has never been this profitable; when it comes to cash, it has never been this strapped. The market, caught between the two, voted with its feet, wiping out nearly 400 billion U. S. dollars in market capitalization overnight.
What exactly went wrong with Google's earnings report? Is such a sharp drop a buying opportunity? Should I sell the shares I'm holding? These are the questions on many people's minds.
To start with the conclusion: Google's business hasn't deteriorated; what has changed is the way it spends money. For the first time, the pace of AI investment has outstripped returns, and the market's patience has failed to keep up. Our long-term view on Alphabet remains unchanged, but in terms of short-term operations, we are more inclined to hold core positioning, add positions in batches, and manage the proportion of individual stocks properly.
The specific rationale is elaborated in five parts: where exactly the financial report fell short of expectations, why the stock price has dropped so sharply, the fundamentals overshadowed by the decline, and where the current valuation stands. As for whether you should hold, add to your position or sell, the answer depends on who you are.
Full Picture of This Quarter's Financial Report: Revenue Is Decent, but Profits and Cash Flow Are Deteriorating
Alphabet released its results for the third quarter of fiscal year 2026 (July–September 2026) after market close on October 28. Judging solely by revenue, this is a solid report: it marks the 13th consecutive quarter of double-digit growth, and its annualized revenue scale has crossed the USD 500 billion threshold. However, issues emerged in the lower section of the income statement and the Cash Flow statement.
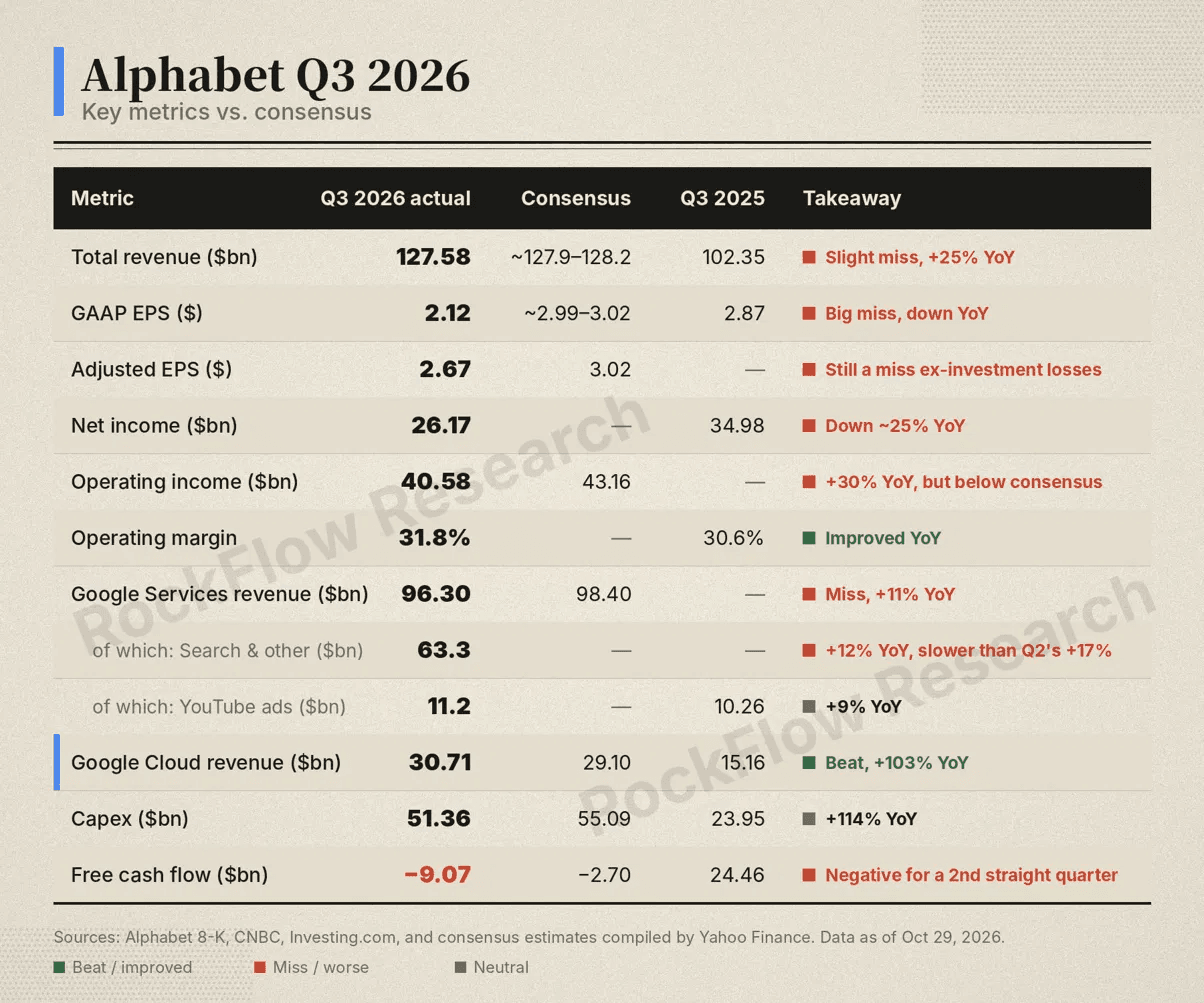
Three details are worth singling out for special attention:
-
The "inflated component" in EPS stems from investment gains and losses. This quarter, the company recorded an equity investment loss of approximately $8.7 billion, compared to a gain of around $10.7 billion in the same period last year, of which roughly $8.2 billion came from unrealized losses on its held SpaceX equity stake. This portion represents non-operating volatility, accounting for a considerable part of the nearly $0.9 gap between GAAP EPS and expectations.
-
However, the operational performance also fell short of targets. The adjusted EPS excluding investment gains and losses still came in below expectations, and Operating Profit was also roughly USD 2.6 billion lower than projected, indicating that the issue goes beyond mere "accounting noise".
-
Cash flow is the real red flag. Capital expenditure in a single quarter reached 51.36 billion US dollars, swallowing up all operating cash flow; free cash flow in Q2 was approximately -5.9 billion US dollars, marking the first negative reading since the company went public 22 years ago, and the figure further widened to -9.07 billion US dollars in Q3. Meanwhile, long-term liabilities rose from 21.6 billion US dollars a year ago to 125.1 billion US dollars, and the company issued 28.7 billion US dollars of senior unsecured bonds this quarter.
Why Did Share Prices Plunge? Triple Pressures Materialize Simultaneously
Google's share price once fell by about 10% in after-hours trading to around $292, dragging down the Nasdaq futures. The RockFlow investment research team believes that this decline was not triggered by a single data point, as threefold pressures are materializing simultaneously in the same earnings report:
Pressure 1: The core business "search" has not provided evidence that AI is an incremental growth driver
The market's biggest concern about Google over the past two years has been whether generative AI would eat into search ads. Search revenue grew by 19% and 17% respectively in Q1 and Q2, which silenced the bears for a while; this quarter, the growth rate fell back to 12%, with both the Services segment and total advertising revenue falling short of expectations.
Some fund managers bluntly stated after the earnings report that the market needs to see search accelerating rather than decelerating, and the stock price may face pressure before search proves that AI is an "add-on" to business. This judgment accurately sums up the sentiment on Wall Street.
Pressure 2: Capital expenditure has no finish line
The company maintains its capital expenditure guidance of USD 195–205 billion for 2026, and the CFO explicitly stated that the figure will "increase significantly" in 2027, with specific numbers to be announced at the Q4 earnings call. The market expects capital expenditure in 2027 to potentially exceed USD 300 billion.
The CFO also cautioned that the buildup of inventory in the TPU system will continue to weigh on free cash flow. For a company once known as a "cash cow", the dynamic of "spending more with no clear timeline for recouping costs" represents a fundamental shift in its valuation logic.
Pressure 3: Peer comparison exacerbates the sense of disparity
That same night, Microsoft was also investing heavily in AI, yet its free cash flow remained positive, with its shares rising roughly 4% in after-hours trading; Google, by contrast, ended up with negative cash flow, and its stock fell by around 10%. The market's pricing rule has become crystal clear: it rewards AI investments that can generate their own cash flow, and punishes those that burn through cash.
Returning to the valuation logic: In the past, the market priced Google based on the metric of "high growth + high cash returns", with its share repurchases and dividends fully backed by abundant free cash flow. Now that its free cash flow has turned negative and liabilities are rising rapidly, the market has been forced to reclassify it from a "cash cow" to an "asset-heavy AI infrastructure player", leading to a downward adjustment in its valuation multiple.
According to analyst consensus compiled by Fiscal.ai, the company's free cash flow is not expected to turn positive until the quarter ending September 2027; separate projections indicate that full-year free cash flow could stand at negative $30 billion in 2027, and will not return to positive territory until 2028. This is the quantitative manifestation of "endless investment with no visible returns".
Fundamentals Overshadowed by the Decline: Where Has the Money Gone, and What Have We Got in Return?
Emotions can reduce an earnings report to nothing more than a headline, but long-term investors need to dig beneath the surface: is the money Google is spending generating verifiable returns? Our answer is that the returns are coming, they just haven’t yet offset the costs.
Google Cloud: From "Also-Ran" to the Second Growth Curve
Cloud revenue for this quarter reached USD 30.7 billion, representing a 103% year-on-year increase and coming in approximately USD 1.6 billion above market expectations; Operating Profit stood at around USD 11.1 billion, more than tripling year-on-year, with the operating margin rising from 23.7% a year earlier to 36.2%.
More crucially, there is the backlog of orders: the quarter-end backlog stood at USD 561 billion, of which just over 55% is expected to be recognized as revenue within the next 24 months.
On this projection, the backlog orders alone will contribute approximately USD 300 billion in revenue over the next two years. Around 65% of capital expenditure is allocated to servers and network equipment, which correspond directly to contracted demand rather than purely speculative expansion.
TPU: From an internal cost item to an external revenue item
The company started recognizing external sales revenue from "TPU Systems"(chips supporting matching hardware and software) from the previous quarter. Currently, nearly 100 clients are using TPUs. The management expects sales to continue growing in Q4, and a significant revenue ramp-up will emerge in 2027.
This means that part of the capital expenditure will directly flow back in the form of hardware sales in the future, rather than just being amortized gradually through cloud services.
Gemini and Search: AI is Expanding Traffic, Not Cannibalizing It
The number of Gemini application users has reached 1 billion; the First-Party model API processes about 32 billion tokens per minute, representing a 40% month-on-month increase and a year-on-year growth of more than 4 times. The company disclosed that the year-on-year growth rate of search queries is the highest in the past five years, and commercial queries are also on the rise.
In other words, there is no loss in user demand; the problem lies in the fact that the efficiency of advertising monetization in the AI search scenario is still on the rise — this is an issue of "monetization pace", not one of "vanishing demand".
The Balance Sheet still has a buffer
Despite the rise in liabilities, Operating Profit still increased by 30% year-on-year, with the annualized Operating Profit standing at approximately 160 billion US dollars; the company announced a quarterly dividend of USD 0.22 per share as usual. Its financing capacity and operating cash flow are sufficient to support the current investment pace, and there is no Liquidity Risk in the short term.
Overall, Google is currently at the typical bottom of the "J-curve": investment comes first, while returns lag behind. What the market is clearly asking is not "whether Google's AI is useful", but rather "when will returns catch up with investment". This determines that our subsequent strategic framework should be designed around "validation nodes" rather than "price levels".
Google's Future Valuation and Scenario Analysis
As this quarter's GAAP earnings are distorted by investment gains and losses, the Price-To-Earnings Ratio has limited reference value at present. We instead adopt "market capitalization / annualized Operating Profit" as a simplified anchor: with the Q3 Operating Profit of USD 40.58 billion, the annualized figure is approximately USD 162.3 billion, and the diluted outstanding shares are roughly 12.34 billion (derived inversely from Net Profit and EPS).
Based on the after-hours price of approximately USD 292, the corresponding market cap stands at around USD 3.6 trillion, roughly 22 times the annualized Operating Profit.
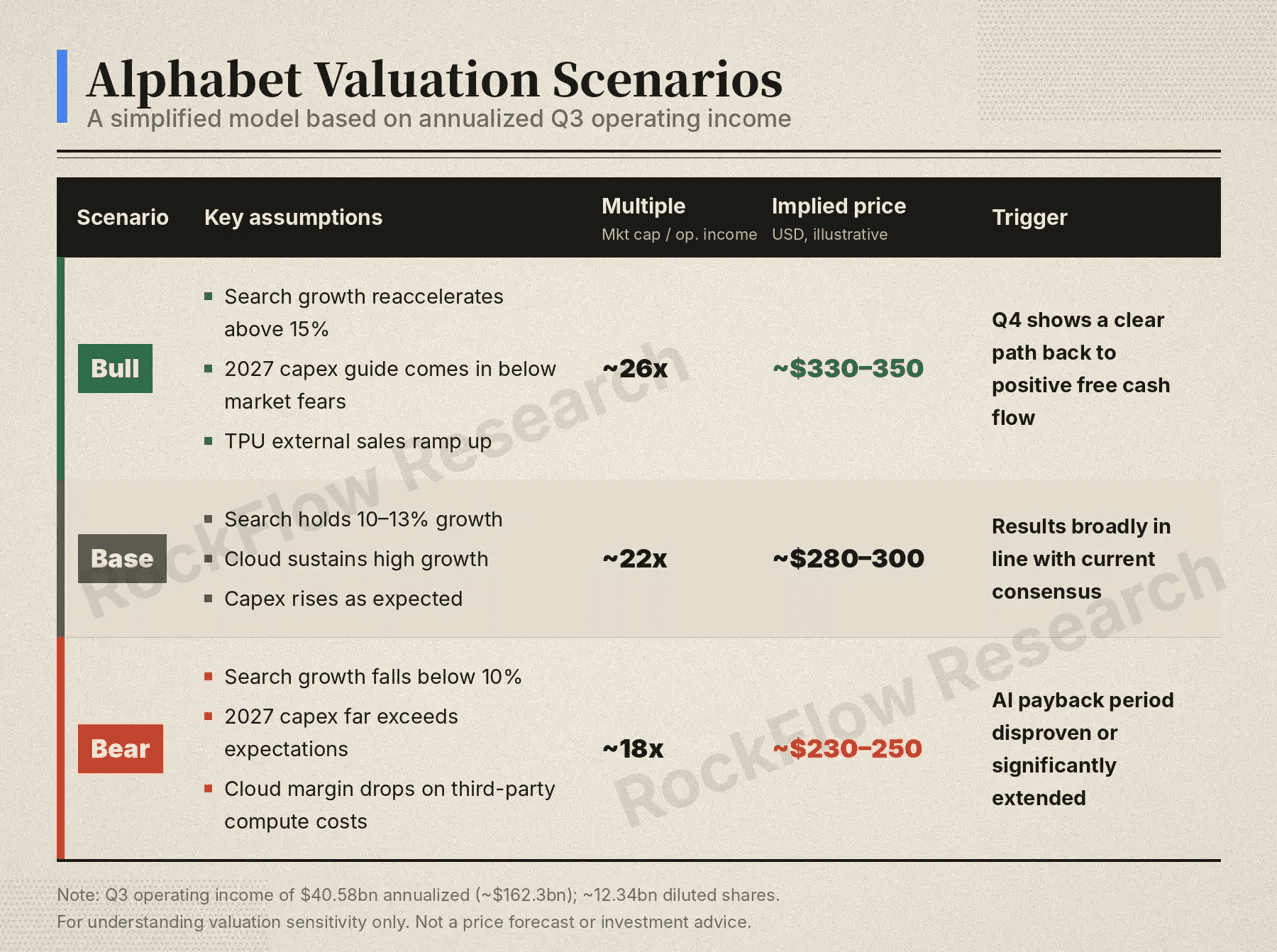
It should be emphasized that the above table is a simplified calculation based on single-quarter annualized data, which is designed to help understand "which variables the valuation is sensitive to", rather than serving as a price forecast.
It reveals a key fact that the current price roughly reflects the neutral scenario, which means that a further decline will need to be driven by additional deterioration in the fundamentals, while a substantial recovery will require positive validation from the Q4 earnings reports.
The RockFlow investment research team believes that the following two short-term variables are worth keeping an eye on:
-
Q4 exchange rate and Cloud profit margin. The management has indicated that the Q4 exchange rate headwind will have an impact of approximately two percentage points on Search and YouTube, and the externally procured third-party computing power will suppress Cloud profit margins in the short term. This means that the data in the next quarterly report will most likely not be "stunning", and expectation management is more important than the data itself.
-
The specific figure for capital expenditure in 2027. This is the single most important variable determining the direction of the valuation multiple, and it will be announced during the Q4 earnings call.
Next, hold, add to position, or sell?
There is no one-size-fits-all answer to the question of whether to hold, add to a position, or sell, as it depends on an investor's cost basis, positioning proportion, and Time Horizon. We provide a framework based on three types of typical investors.
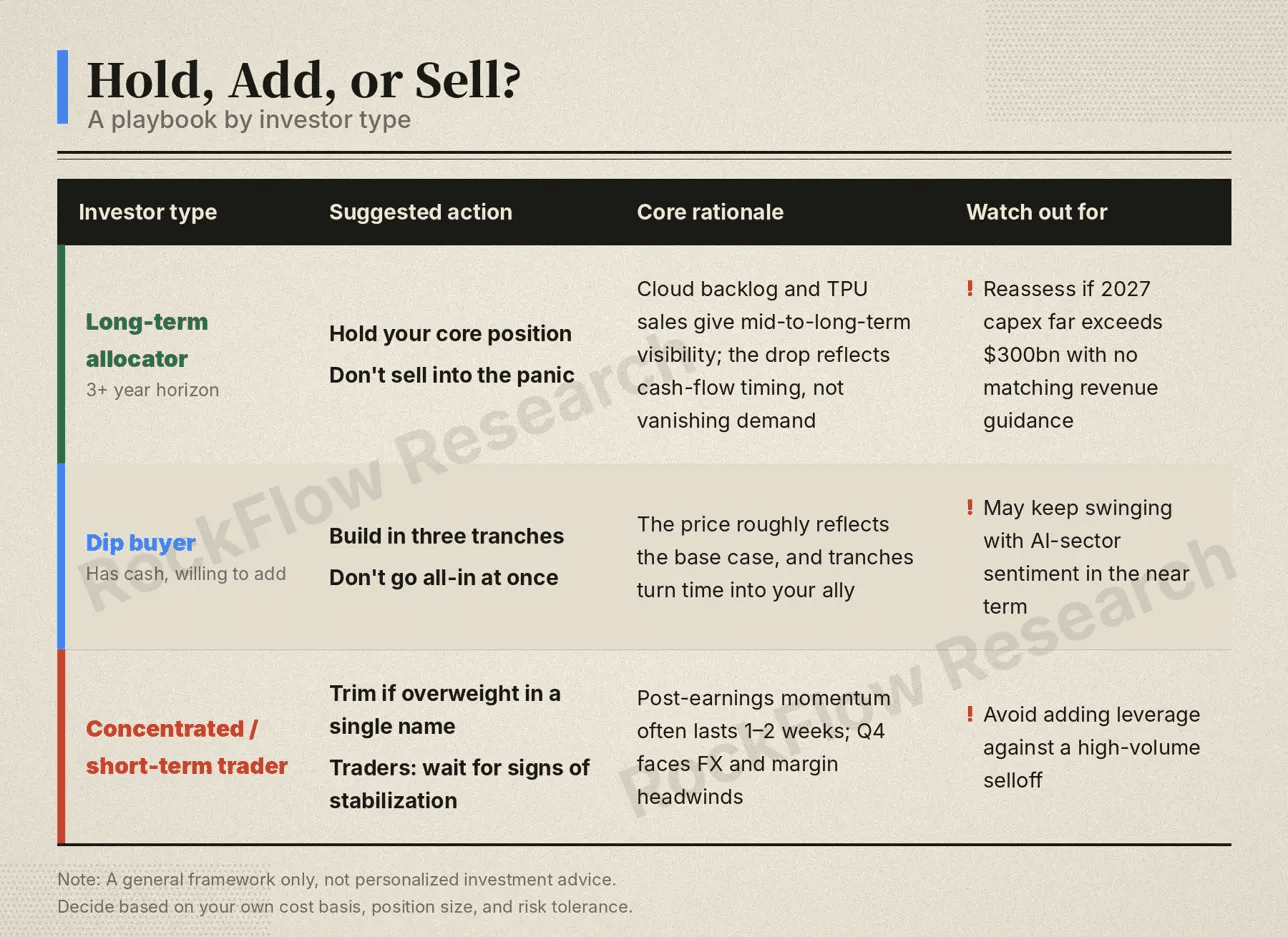
"Three-stage" staged position-adding framework:
First tranche (approximately 1/3 of the planned additional position size): Enter the position when the stock price stabilizes in the $280–$300 range after the earnings report and trading volume recedes, corresponding to the pricing under the neutral scenario.
Second batch (approx. 1/3): If the price dips to around $250 due to sector sentiment, while the fundamental indicators (Cloud growth rate, backlog) do not deteriorate, proceed with the execution.
The third batch (about one-third): Reserved for the verification results from the Q4 earnings report — if the 2027 capital expenditure guidance is manageable and the search growth rate stabilizes and rebounds, add positions after confirmation; even if it means buying at a slightly higher price, we must prioritize certainty in our purchases.
The conditions for selling or reducing positions should be written down in advance rather than decided on the spur of the moment. For example, look for revenue growth that has been below 10% for two consecutive quarters; a clear stall in Cloud growth or a month-on-month decline in backlog; a 2027 capital expenditure guidance that significantly exceeds expectations with no corresponding revenue or cash flow trajectory. If any two of these conditions are met, the position-holding logic should be reassessed.
As for positioning discipline, we believe that no matter how confident we are in Google, the proportion of a single stock in the portfolio should not be excessively high. The decision to increase Google's holdings should be considered in conjunction with the overall technology exposure, rather than being made in isolation.
Turn your judgment into a backtestable strategy
How to deal with the significant fluctuation of the stock price of your holdings after the release of financial reports? This is a question that all investors have to face squarely. Most people will have more or less some thoughts after reading the financial reports, for example, "The cloud business is so strong, so a dip in price should be an opportunity", or "Capital expenditure keeps rising, so it's better to sell out first to avoid risks".
But what is truly difficult is to turn this idea into a well-founded, disciplined and actionable plan.
For Bobby, this is precisely the ideal scenario where it can bring its capabilities into full play. You state what you observe, and it does the math for you; you declare what you believe in, and it keeps you disciplined, then verifies everything against historical data. You can:
Go into the conversation with your own perspective
For example, "I think the market is overly worried about Google's capital expenditure, and the cloud business's on-hand orders are sufficient to cover the investment. " Bobby will help you find evidence both for and against this view, and point out the risks you might have overlooked.
Turn ideas into a well-rounded strategy
Tell it your position cost, positioning and acceptable drawdown, and it will break down a directional judgment into specific position-building rhythm, conditions for adding or reducing positions, and stop-loss rules, just like the fifth part of this article, but customized exclusively for you.
Test it with historical data
Many ideas that sound perfectly plausible fall apart the moment you test them against historical data. For instance, if you want to verify the rule "buy large-cap tech stocks that have fallen more than 8% in a single day after their earnings report and hold them for three months", you can simply have Bobby run a backtest to see what its historical win rate, returns and maximum drawdown actually look like, before deciding whether to put real money into executing it.
We have always believed that sound investment decisions should be reviewable and verifiable, rather than based on gut feelings or a casual remark from some internet influencer. This was exactly Bobby's original vision: to put a research partner at the side of every retail investor, someone you can discuss ideas with anytime, help you turn those ideas into a concrete plan, and then test it all against hard data.
Following Google's recent slump, some see risks while others spot opportunities. No matter which side you stand on, feel free to share your judgment with Bobby, and let it build a tailored strategy for you — just run a backtest first to see how it performs.
Related Content