AI Chip Stocks Slide: Micron Falls 7% and NVIDIA Drops 2.3%—Are High Rates Repricing AI Valuations?

RockFlow Jacko
August 19, 2026 · 14 min read
AI stocks came under pressure again.
At the close on August 18, Micron fell 7%, NVIDIA declined 2.3%, and Broadcom lost 3.2%. Weakness in major technology and semiconductor stocks pulled the Nasdaq Composite down 1.3%, while the S&P 500 fell 0.7% and the Dow Jones Industrial Average slipped 0.2%.
There was no single factor behind the selloff. AI stocks had already accumulated substantial gains, leaving valuations more sensitive to changes in expectations. Long-term U.S. Treasury yields remained elevated, maintaining pressure on the present value of future earnings. Investors were also asking when rapidly expanding data center spending would begin to generate more visible revenue, cash flow, and returns.
The market’s focus is evolving. Strong AI demand still matters, but orders, margins, cash flow, and returns on capital must increasingly keep pace with valuations.
Key Takeaways
- What happened: Micron fell 7%, NVIDIA declined 2.3%, and Broadcom lost 3.2%, while the Nasdaq Composite dropped 1.3%.
- Why it matters: AI chip valuations depend heavily on future growth. When elevated valuations meet high interest rates, stock prices become more sensitive to demand and earnings expectations.
- The main uncertainty: Investors still need evidence that demand for GPUs, HBM, and custom accelerators can translate into sustainable revenue, profit, and cash flow.
What Happened?
All four major U.S. equity indexes finished lower on August 18.
| Indicator | Daily Change | Closing Level | Why It Matters |
|---|---|---|---|
| S&P 500 | -0.7% | 7,691.76 | A third consecutive decline after reaching a record high |
| Nasdaq Composite | -1.3% | 26,289.71 | Technology and AI-related stocks faced heavier pressure |
| Dow Jones Industrial Average | -0.2% | 53,343.40 | Traditional sectors were relatively resilient |
| Russell 2000 | -1.3% | 3,017.89 | Smaller companies were also affected by weaker risk appetite |
| 10-year U.S. Treasury yield | Down about 2 basis points | Approximately 4.70% | Slightly lower on the day, but still elevated in absolute terms |
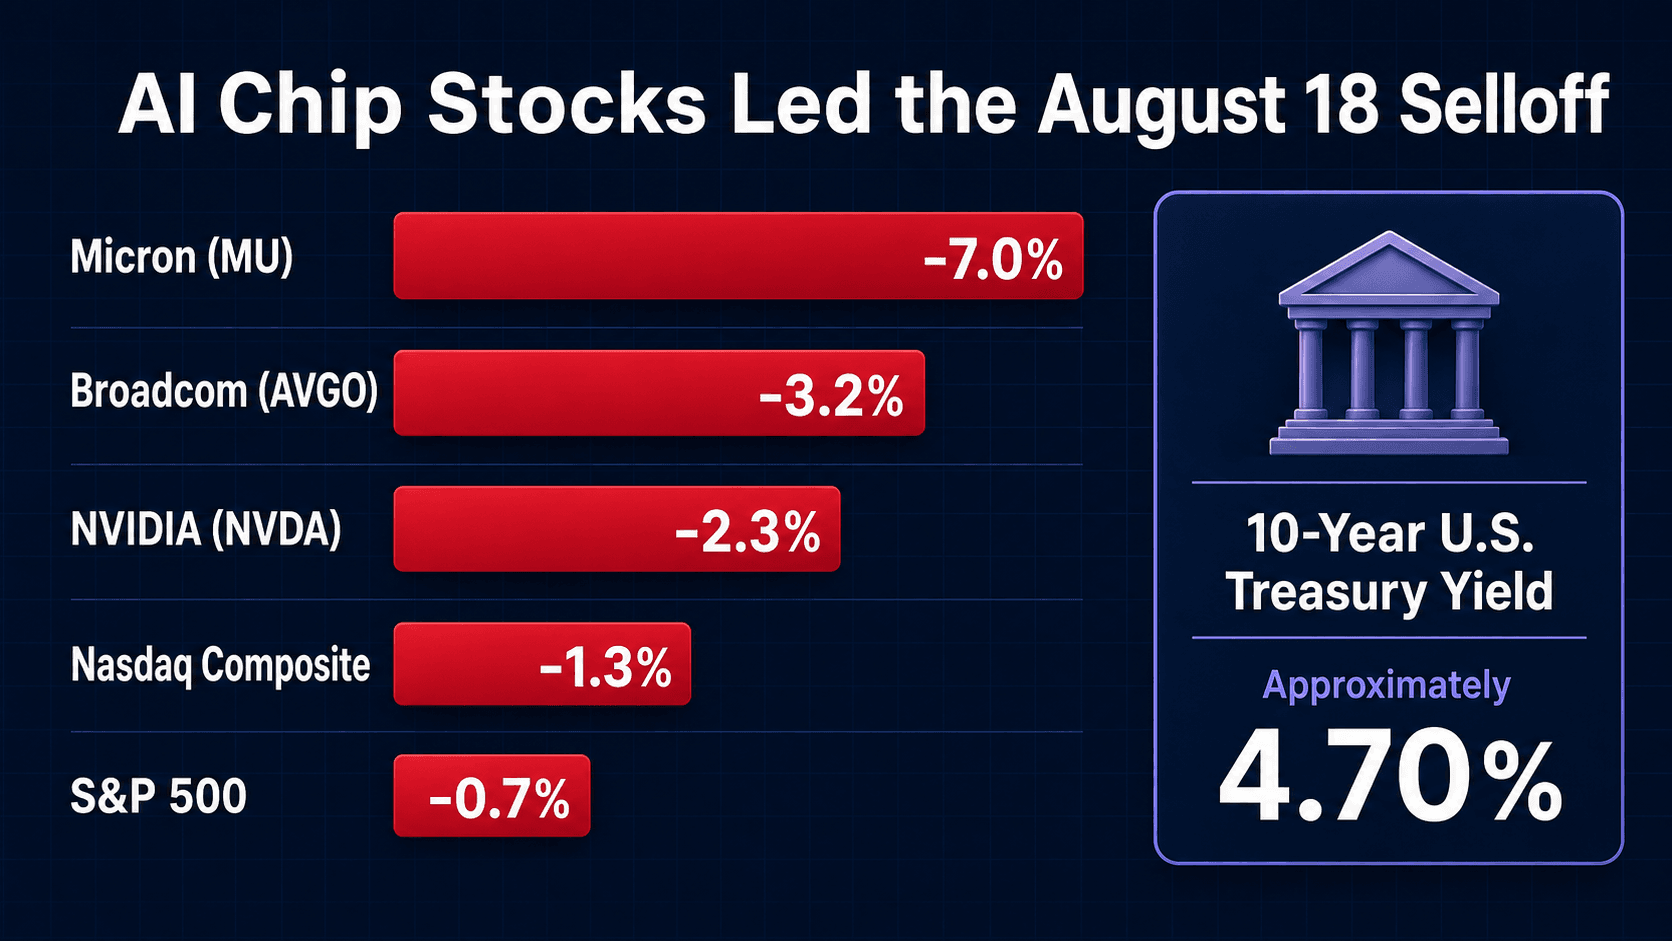 Illustrative market snapshot based on the August 18 close. The 10-year Treasury yield is shown separately and should not be interpreted as the sole cause of the equity selloff.
Micron, NVIDIA, and Broadcom represent different parts of the AI infrastructure chain, spanning memory, accelerated computing, custom chips, and data center networking.
Their simultaneous declines indicate that the AI stocks selloff reflected broader pressure across the sector. Investors were reassessing the valuation of the AI infrastructure chain rather than responding to one company-specific event.
Why It Matters: How Do High Interest Rates Affect AI Valuations?
The 10-year U.S. Treasury yield edged down from about 4.72% to 4.70% during the session. It would therefore be misleading to describe the selloff as a direct reaction to a sudden increase in rates that day.
A more accurate interpretation is that high interest rates remain a persistent valuation backdrop.
A stock’s value reflects expectations for the cash flows a company may generate in the future. When interest rates remain elevated, those future earnings are discounted more heavily. The effect can be more pronounced for companies whose valuations depend on profits expected further into the future.
AI chip companies have benefited from rapid demand growth and substantial valuation expansion. Investors have been willing to pay a premium for the long-term potential of GPUs, HBM, custom accelerators, and data center networking. As those valuations rise, the market becomes increasingly sensitive to several questions:
- Will cloud service providers continue raising AI capital expenditure?
- Can GPU and HBM orders be delivered on schedule?
- Will new computing capacity achieve sufficient utilization?
- Can AI service revenue cover the cost of infrastructure?
- Can earnings growth support current valuation multiples?
This explains why searches related to Treasury yields tech stocks and AI valuation risk often appear together. High rates do not automatically end an AI growth cycle, but they raise the level of financial performance required to sustain premium valuations.
Key Data: Why Did Micron Fall More?
Micron’s 7% decline was considerably larger than the losses recorded by NVIDIA and Broadcom.
Micron sits at the intersection of the memory cycle and the AI investment cycle. AI servers require large amounts of HBM and server DRAM, making the HBM demand outlook an important industry indicator. Yet memory remains cyclical, with pricing shaped by supply, inventory, capacity allocation, and expansion plans.
When evaluating Micron, the market typically watches:
- HBM orders and capacity reservations;
- DRAM contract pricing;
- Data center revenue growth;
- Memory inventory levels;
- New capacity and advanced packaging progress;
- Capital expenditure and gross margin.
When investors become concerned about returns on AI infrastructure, memory suppliers may experience sensitivity on two fronts: expectations for AI demand and expectations for the broader memory pricing cycle.
The phrase MU stock down 7 percent should therefore not be interpreted as evidence that HBM demand suddenly disappeared. The move is better understood in the context of valuation pressure, memory-cycle risk, and changing investor risk appetite.
What Did the Moves in NVIDIA and Broadcom Signal?
NVIDIA: Investors Are Testing the Durability of Platform Demand
The NVDA stock decline received particular attention because NVIDIA remains central to the AI infrastructure market.
NVIDIA’s position now extends beyond individual GPUs. Its product ecosystem includes networking, high-speed interconnects, software tools, and rack-scale systems. Larger customer deployments create more opportunities for system-level revenue, but they also place greater emphasis on delivery schedules, energy requirements, and project economics.
The market will continue watching:
- Deliveries of next-generation GPUs and rack-scale systems;
- Capital expenditure by hyperscalers;
- Data center revenue and gross margin;
- Networking growth and software adoption;
- The ability of customers to monetize new computing capacity.
The pullback shows that investors are demanding more evidence of execution. It does not, by itself, confirm that AI demand has reversed.
Broadcom: Custom Accelerators and Networking Must Also Meet Expectations
The Broadcom stock selloff represents another branch of the AI infrastructure market.
Broadcom participates in custom AI accelerators and data center networking. As hyperscalers develop more in-house chips, custom accelerators have become an important source of growth alongside general-purpose GPUs.
Key variables include:
- AI semiconductor revenue;
- The number of custom-chip customers;
- Data center networking demand;
- The timing of new projects entering volume production;
- Whether AI growth can support Broadcom’s overall valuation.
Broader adoption of internally designed chips could expand Broadcom’s order opportunities. Delays in certification, volume production, or customer spending could push revenue recognition further into the future.
Investor Impact: AI Is Entering a Return-on-Investment Phase
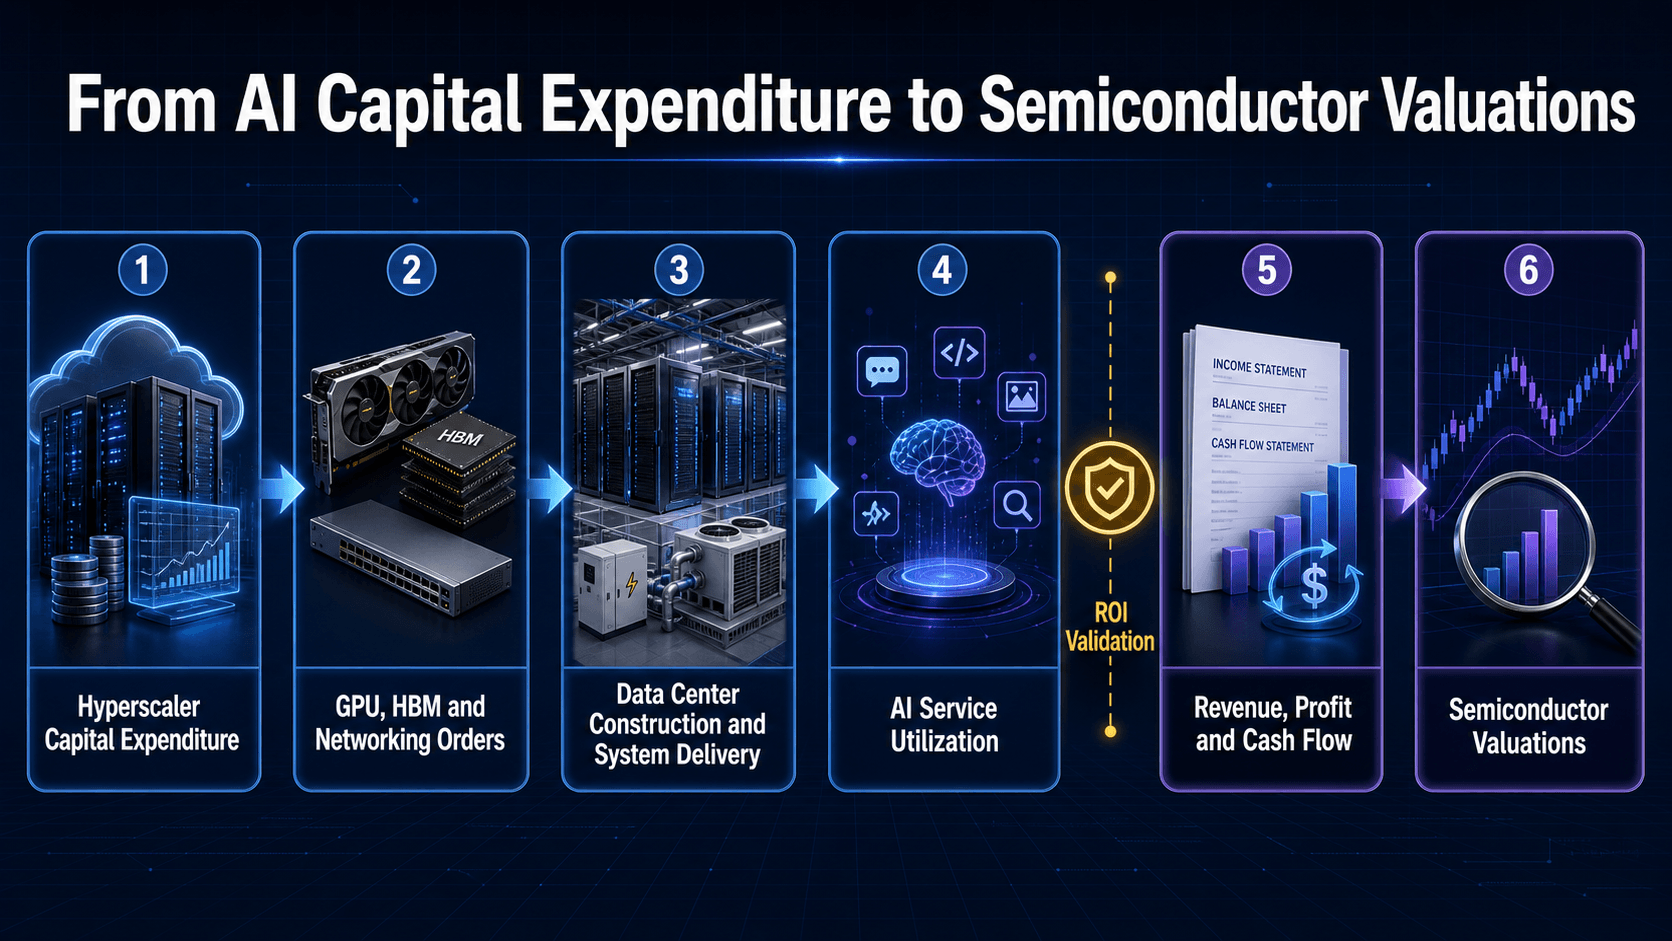 Illustrative transmission framework. Capital expenditure must move through delivery, utilization, and financial performance before it can support semiconductor valuations.
The AI infrastructure debate is moving from the scale of spending toward the quality of returns.
Major technology companies continue buying accelerators, building data centers, and securing additional power capacity. The next question concerns AI data center ROI: can the new computing capacity generate enough usage, revenue, and cash flow?
The transmission chain can be summarized as follows:
Hyperscaler capital expenditure
→ GPU, HBM, and networking orders
→ Data center construction and system delivery
→ AI service utilization
→ Revenue, profit, and cash flow
→ Semiconductor valuations
Capital expenditure at the front of this chain may remain strong. Investors will increasingly examine the commercial results at the other end.
If revenue growth fails to keep pace with investment, valuation pressure could increase. If AI usage continues expanding and orders translate into stronger margins and cash generation, the sector’s fundamentals may receive further support.
Bull Case vs. Bear Case
The scenarios below illustrate different potential paths. They do not represent investment conclusions.
| Area to Watch | Bull Case | Bear Case |
|---|---|---|
| Hyperscaler spending | AI capital expenditure continues growing | Spending growth slows or projects are delayed |
| Chip demand | GPU, HBM, and networking orders continue rising | Customers digest inventory and new orders cool |
| Earnings conversion | Revenue, margins, and cash flow improve together | Revenue rises while costs grow and cash returns lag |
| Interest-rate environment | Long-term yields decline, easing valuation pressure | High rates continue weighing on long-duration valuations |
| Data center economics | Utilization and AI service revenue improve | Power and equipment spending outpace revenue |
For semiconductor stocks, the more meaningful dividing line will come from orders, deliveries, margins, and cash flow. A one-day decline provides information about market sentiment, but it cannot confirm a complete change in the industry cycle.
What RockFlow and Bobby AI Found
The AI chip theme spans GPUs, HBM, custom accelerators, networking equipment, and cloud service providers. Relevant information is distributed across earnings reports, product announcements, capital expenditure guidance, and supply-chain updates.
With RockFlow, users can place Micron, NVIDIA, Broadcom, and AMD (AMD) within the same thematic framework. They can also monitor broader sector performance through the VanEck Semiconductor ETF (SMH) and the iShares Semiconductor ETF (SOXX).
Bobby AI can help organize company announcements, earnings reports, capital expenditure plans, and industry developments. This makes it easier to compare orders, product exposure, and earnings conversion across companies.
For users researching U.S. equities through rockflow ai or another ai trading app, this framework places daily price changes within a broader discussion of interest rates, valuations, and industry cycles.
For readers comparing market research tools under the search phrase Best for Beginners, transparent data sources, clear update times, and visible risk disclosures may be more useful than a single directional conclusion. Users searching for ai invest tools should also avoid interpreting short-term price movements as long-term trends without supporting evidence.
What to Watch Next
Four groups of indicators may provide the clearest signals.
Interest Rates
Monitor the 10-year and 30-year U.S. Treasury yields. A sustained decline could reduce pressure on long-duration growth valuations, while persistently high yields could keep the market focused on near-term earnings.
Demand
Watch whether hyperscalers change their AI capital expenditure plans. Lower spending guidance or project delays could affect expectations across GPUs, memory, networking, power equipment, and data center construction.
Delivery
Track whether GPU, HBM, and custom-chip orders convert into revenue on schedule. Product delays, packaging constraints, or changes in customer deployment plans could affect the timing of financial results.
Returns
Follow AI service revenue, data center utilization, gross margins, and free cash flow. These figures can help show whether infrastructure investment is producing measurable commercial returns.
If Treasury yields decline while chip orders, margins, and cloud-service revenue continue growing, valuation pressure may ease.
If capital spending slows, deliveries are postponed, or memory inventory rises, high-valuation AI stocks and the broader semiconductor ETF category may remain volatile.
Final Thoughts
Micron’s 7% decline, NVIDIA’s 2.3% loss, and Broadcom’s 3.2% drop show that investors are reassessing valuations and returns across the AI infrastructure chain.
The 10-year Treasury yield declined slightly during the session, so elevated rates are better viewed as a continuing valuation condition than as the sole cause of the selloff. Previous gains in AI stocks, concerns about data center economics, and changes in risk appetite also shaped the market reaction.
The next phase of the AI chip cycle will depend on two competing speeds: how quickly orders and revenue grow, and how quickly companies deliver the earnings required to support their valuations.
FAQ
Why did Micron fall more than NVIDIA?
Micron is exposed to both AI demand and the memory cycle. HBM orders, DRAM pricing, inventory, capacity allocation, and expansion plans can all affect expectations. A single trading-day decline does not prove that HBM demand has weakened.
Do high interest rates always cause AI stocks to fall?
No. High rates raise the valuation hurdle, but stronger revenue, profit, and cash-flow growth can offset some of that pressure. Performance ultimately depends on the relationship between fundamentals and valuation.
Does the sector-wide decline mean AI demand has peaked?
The available evidence does not support that conclusion. Hyperscaler capital expenditure, GPU and HBM orders, system deliveries, and data center utilization still need to be monitored.
Which indicators could signal that pressure is easing?
Key indicators include the 10-year Treasury yield, hyperscaler capital expenditure, NVIDIA system deliveries, Micron’s HBM and DRAM trends, Broadcom’s AI semiconductor revenue, and the performance of SMH and SOXX.
Sources
- AP: Sinking AI stocks pull Wall Street further from its record
- AP: How major US stock indexes fared Tuesday, August 18, 2026
Risk Disclosure
This article was prepared by RockFlow for market information, industry research, and investor education only. It does not constitute investment advice, trading advice, or a guarantee of returns.
Market prices, Treasury yields, company guidance, and operating information may change over time. Readers should refer to the latest market data and official company disclosures.