2026年黄金暴跌:4万亿美元的抛售是流动性危机还是抄底机会?

RockFlow Shayne
February 6, 2026 · 5 min read

划重点 ① 贵金属 1 月底的暴跌并非基本面的溃败,而是高杠杆多头的集体谢幕。2026 年初,过度超买的黄金在凯文·沃什入主联储的预期下闪崩,演变为吞噬一切的流动性黑洞。为弥补黄金头寸的巨额亏损,对冲基金被迫抛售流动性极佳的科技巨头,导致纳斯达克陪葬。
② 沃什对美元信用的强硬捍卫,让此前盛行的“美元崩溃论”遇冷。历史总是在恐慌中押韵,正如 2008 与 2020 年的洗盘,黄金往往在流动性危机初期率先补跌,以此完成对投机资金的出清。
③ 抄底不仅需要勇气,更考验对时机的精准拿捏。当下需紧盯美元指数的斜率拐点与 CME 保证金的下调信号,确认“飞刀”是否已经落地。当市场为了生存而不得不卖出心爱之物时,往往正是价值回归的最佳伏击点。
2026 年 1 月底,贵金属多头们经历了职业生涯中最黑暗的一天。
曾被奉为“乱世金律”的避险资产,在短短数十小时内演绎了一场史诗级溃败。现货黄金市值蒸发近 4 万亿美元,白银、铂金、钯金更是以两位数的跌幅垂直落水。这种量级的波动,令无数信奉“通胀买金”逻辑的投资者目瞪口呆。
这会是贵金属牛市的终结,还是物理资产的一次“极端排毒”?在 RockFlow 投研团队看来,要理解这场屠杀,必须穿透表象的价格数字,直视流动性枯竭与货币权力更迭的深层博弈。
1. 解读美元指数(DXY):黄金价格反弹的第一个信号
2026 年初这场惨烈的震荡,向全球投资者展示了一个极具讽刺意味的金融悖论:原本作为最后防线的黄金,竟成了引爆纳斯达克溃败的导火索。
回望 1 月中旬,黄金的叙事本近乎完美。全球央行以五倍于历史均速的节奏疯狂囤金,地缘迷雾经久不散,金价一度冲破 5600 美元/盎司的心理大关。
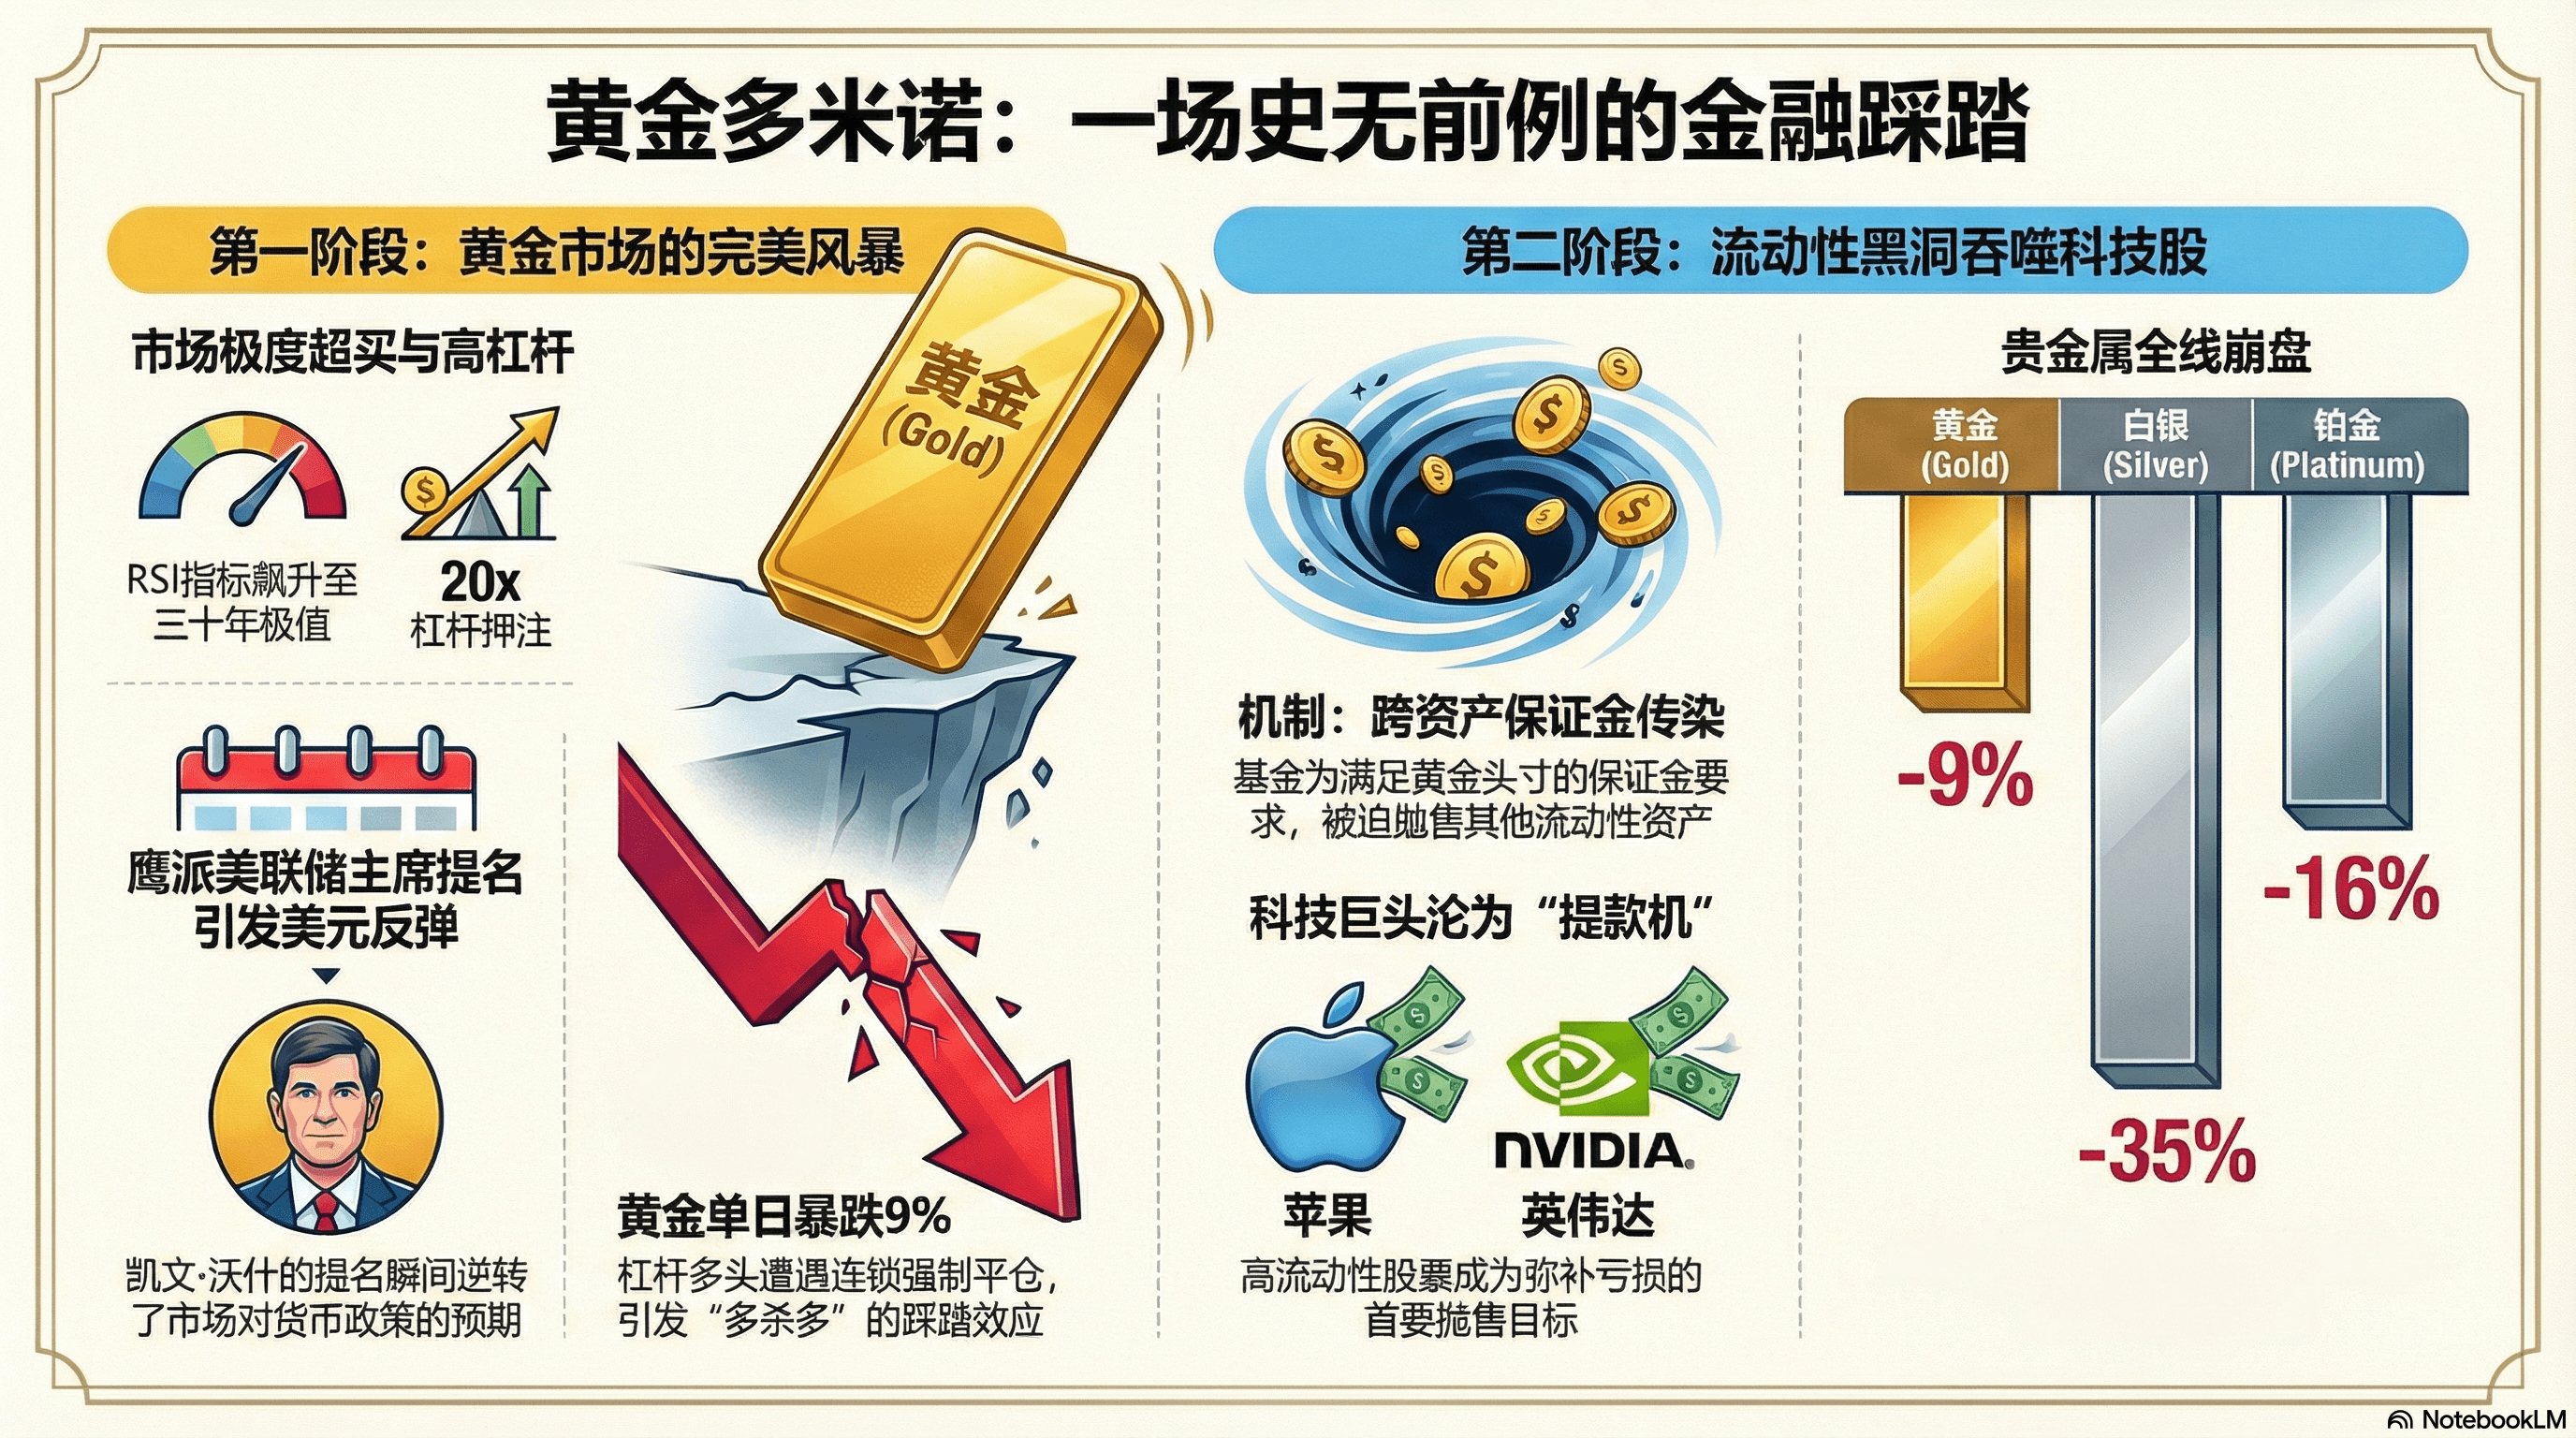
然而,在完美叙事的幕布后,脆弱的头寸结构早已摇摇欲坠。当时黄金的 14 日相对强弱指数(RSI)飙升至 90 以上,这种处于三十年极值的超买状态,意味着多头已身处悬崖边缘。
杠杆加速了火药桶的堆积。大量对冲基金押注黄金为“后美元时代”的唯一真神,套上 10 至 20 倍的杠杆博取价差。在那一刻,黄金不再是避风港,而是一座堆满干柴、只待火星的薪场。
而就在这一重要节点,1 月 30 日,特朗普提名凯文·沃什(Kevin Warsh)担任下届美联储主席的消息,成为了那枚引爆火药桶的“针”。
沃什长期以来对货币扩张的批判立场,瞬间点燃了美元反弹的引信,美元指数(DXY)盘中直线拉升。
对于杠杆多头而言,美元的哪怕 1% 的反向波动,叠加 20 倍杠杆,就是 20% 的净值回撤。当金价从高位坠落,触发了算法交易的自动止损。
紧接着,史无前例的连锁踩踏爆发,黄金市场在 24 小时内刷写了历史性的强平纪录。这种“多杀多”的负反馈循环,将金价拽入单日暴跌 9% 的深渊。
至于为什么黄金的崩溃会直接拉低苹果、微软和英伟达的股价?答案在于“跨资产保证金关联(Cross-Asset Margin Contagion)”。
当对冲基金在黄金头寸上遭遇断头式强平,它们面临的是迫在眉睫的追加保证金要求。在 2026 年流动性本就偏紧的环境下(美联储逆回购规模已降至低位),这些基金无法在短时间内筹措足够现金,只能“卖掉一切可以卖的东西”。
于是,市场上出现了极度诡异的一幕:作为“现金奶牛”且流动性极佳的美股科技巨头(Mag7),成了对冲基金弥补黄金亏损的提现机。
纳斯达克随黄金闪崩而共振,科技股的回撤又进一步恶化了基金净值,从而引发了更广泛的流动性恐慌。
在极端的杠杆市中,流动性本身就是稀缺品。当最稳固的“避险底座”——黄金——因为杠杆过载而崩塌时,它不仅无法避险,反而因其巨大的体量和流动性,成为了拖累所有风险资产坠入深渊的重锤。
白银与铂金在流动性黑洞中同样无法幸免。白银单日狂泻 35%,铂金暴跌 16%,共同创下了历史性的至暗纪录。
2. 追踪CME保证金变化:如何判断机构去杠杆底部的信号
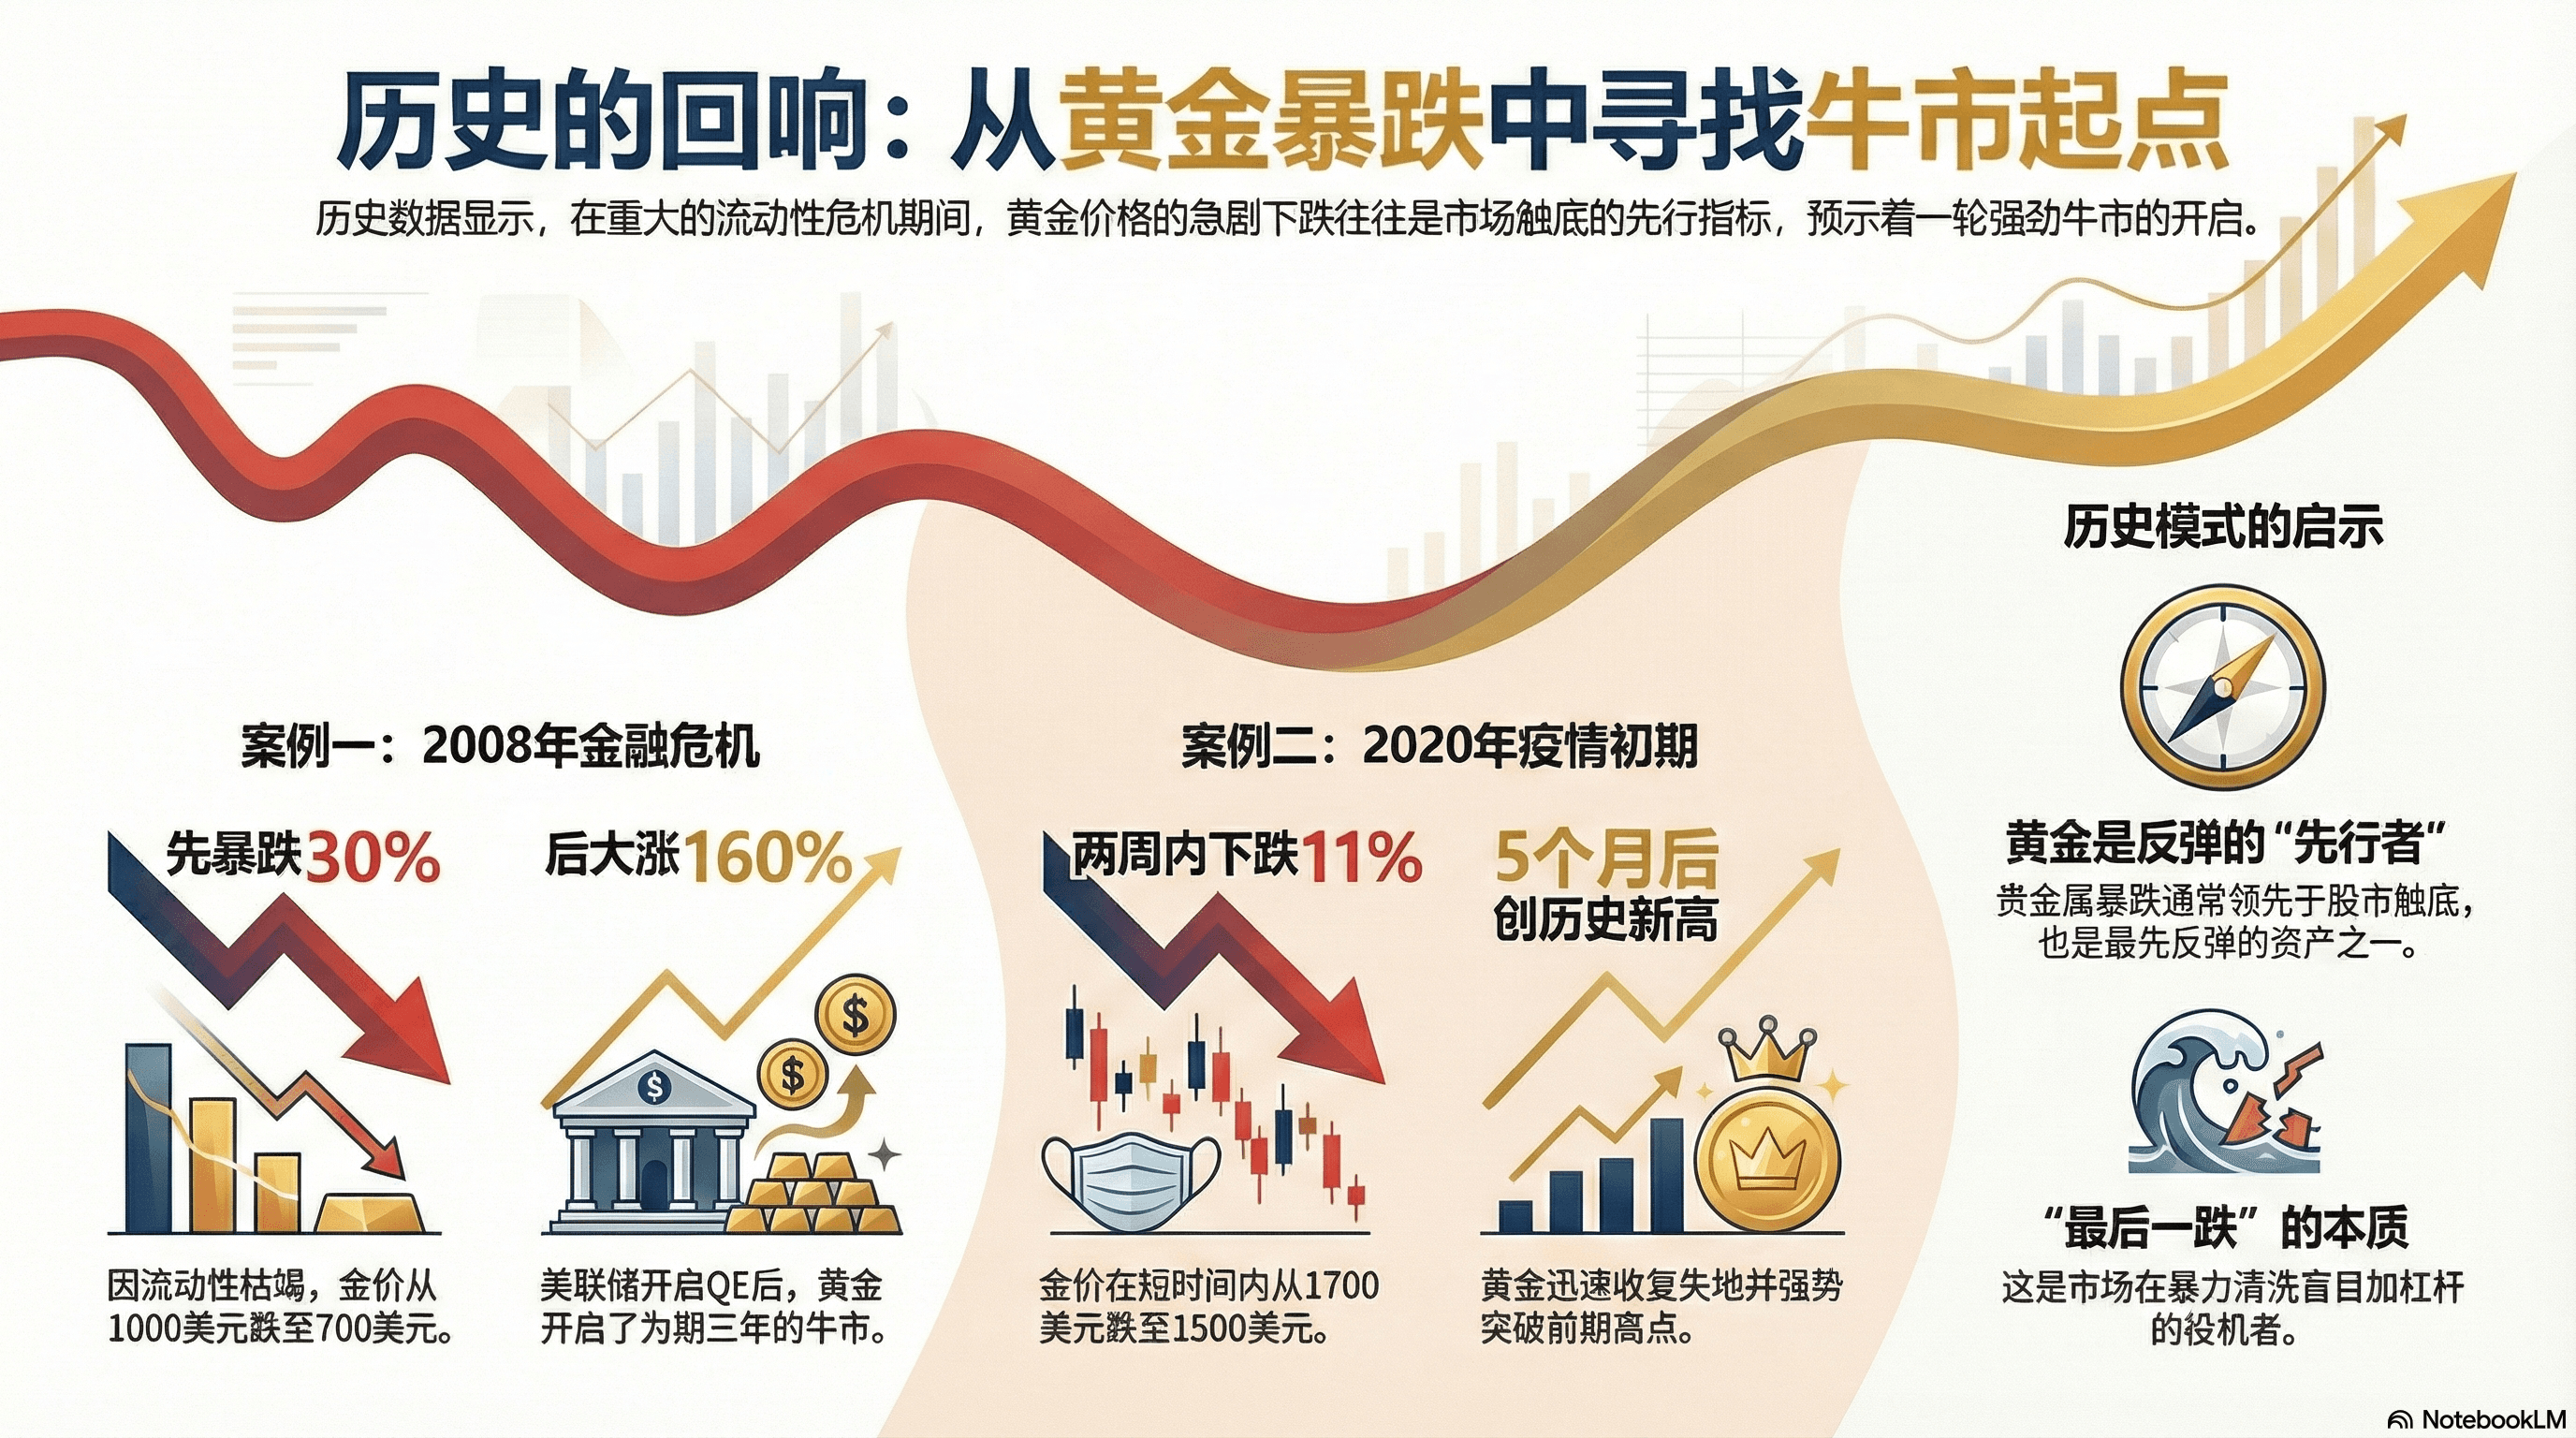
历史不会简单重复,但往往押韵。我们可以从 2008 年和 2020 年这两次著名的贵金属崩盘中寻找抄底的时间线:
- 2008 年金融危机:标普 500 开始暴跌时,黄金先从每盎司 1000 美元摔到了 700 美元,跌幅达 30%,因为流动性枯竭。但随后,在美联储开启 QE 的瞬间,黄金随即掉头向上,此后开启了涨幅达 160% 的三年牛市。
- 2020 年疫情初期:黄金在两周内暴跌 11%(从 1700 跌至 1500),随后仅用 5 个月时间就创下了当时的历史新高。
这种共性清晰地昭示:流动性危机中的贵金属暴跌,往往领先于股市触底。当机构“卖无可卖”、保证金空缺补齐后,黄金通常是最先反弹并收复失地的资产。
2026 年初的这场突发跌势,更像是一场针对过去两年贵金属过度繁荣的“硬着陆测试”,本质上是市场在暴力清洗那些盲目加杠杆的投机余毒。
3. 金价暴跌是陷阱吗?抓住黄金见底的关键指标
针对贵金属市场的“黑色星期五”,抄底不仅考验技术,更是一场心理战。很多投资者死在“黎明前的黑暗”,正是因为缺乏一套量化的、可执行的刻度体系。
基于 RockFlow 投研团队对历史流动性危机的复盘,我们认为投资者需要将视线聚焦于以下三点:
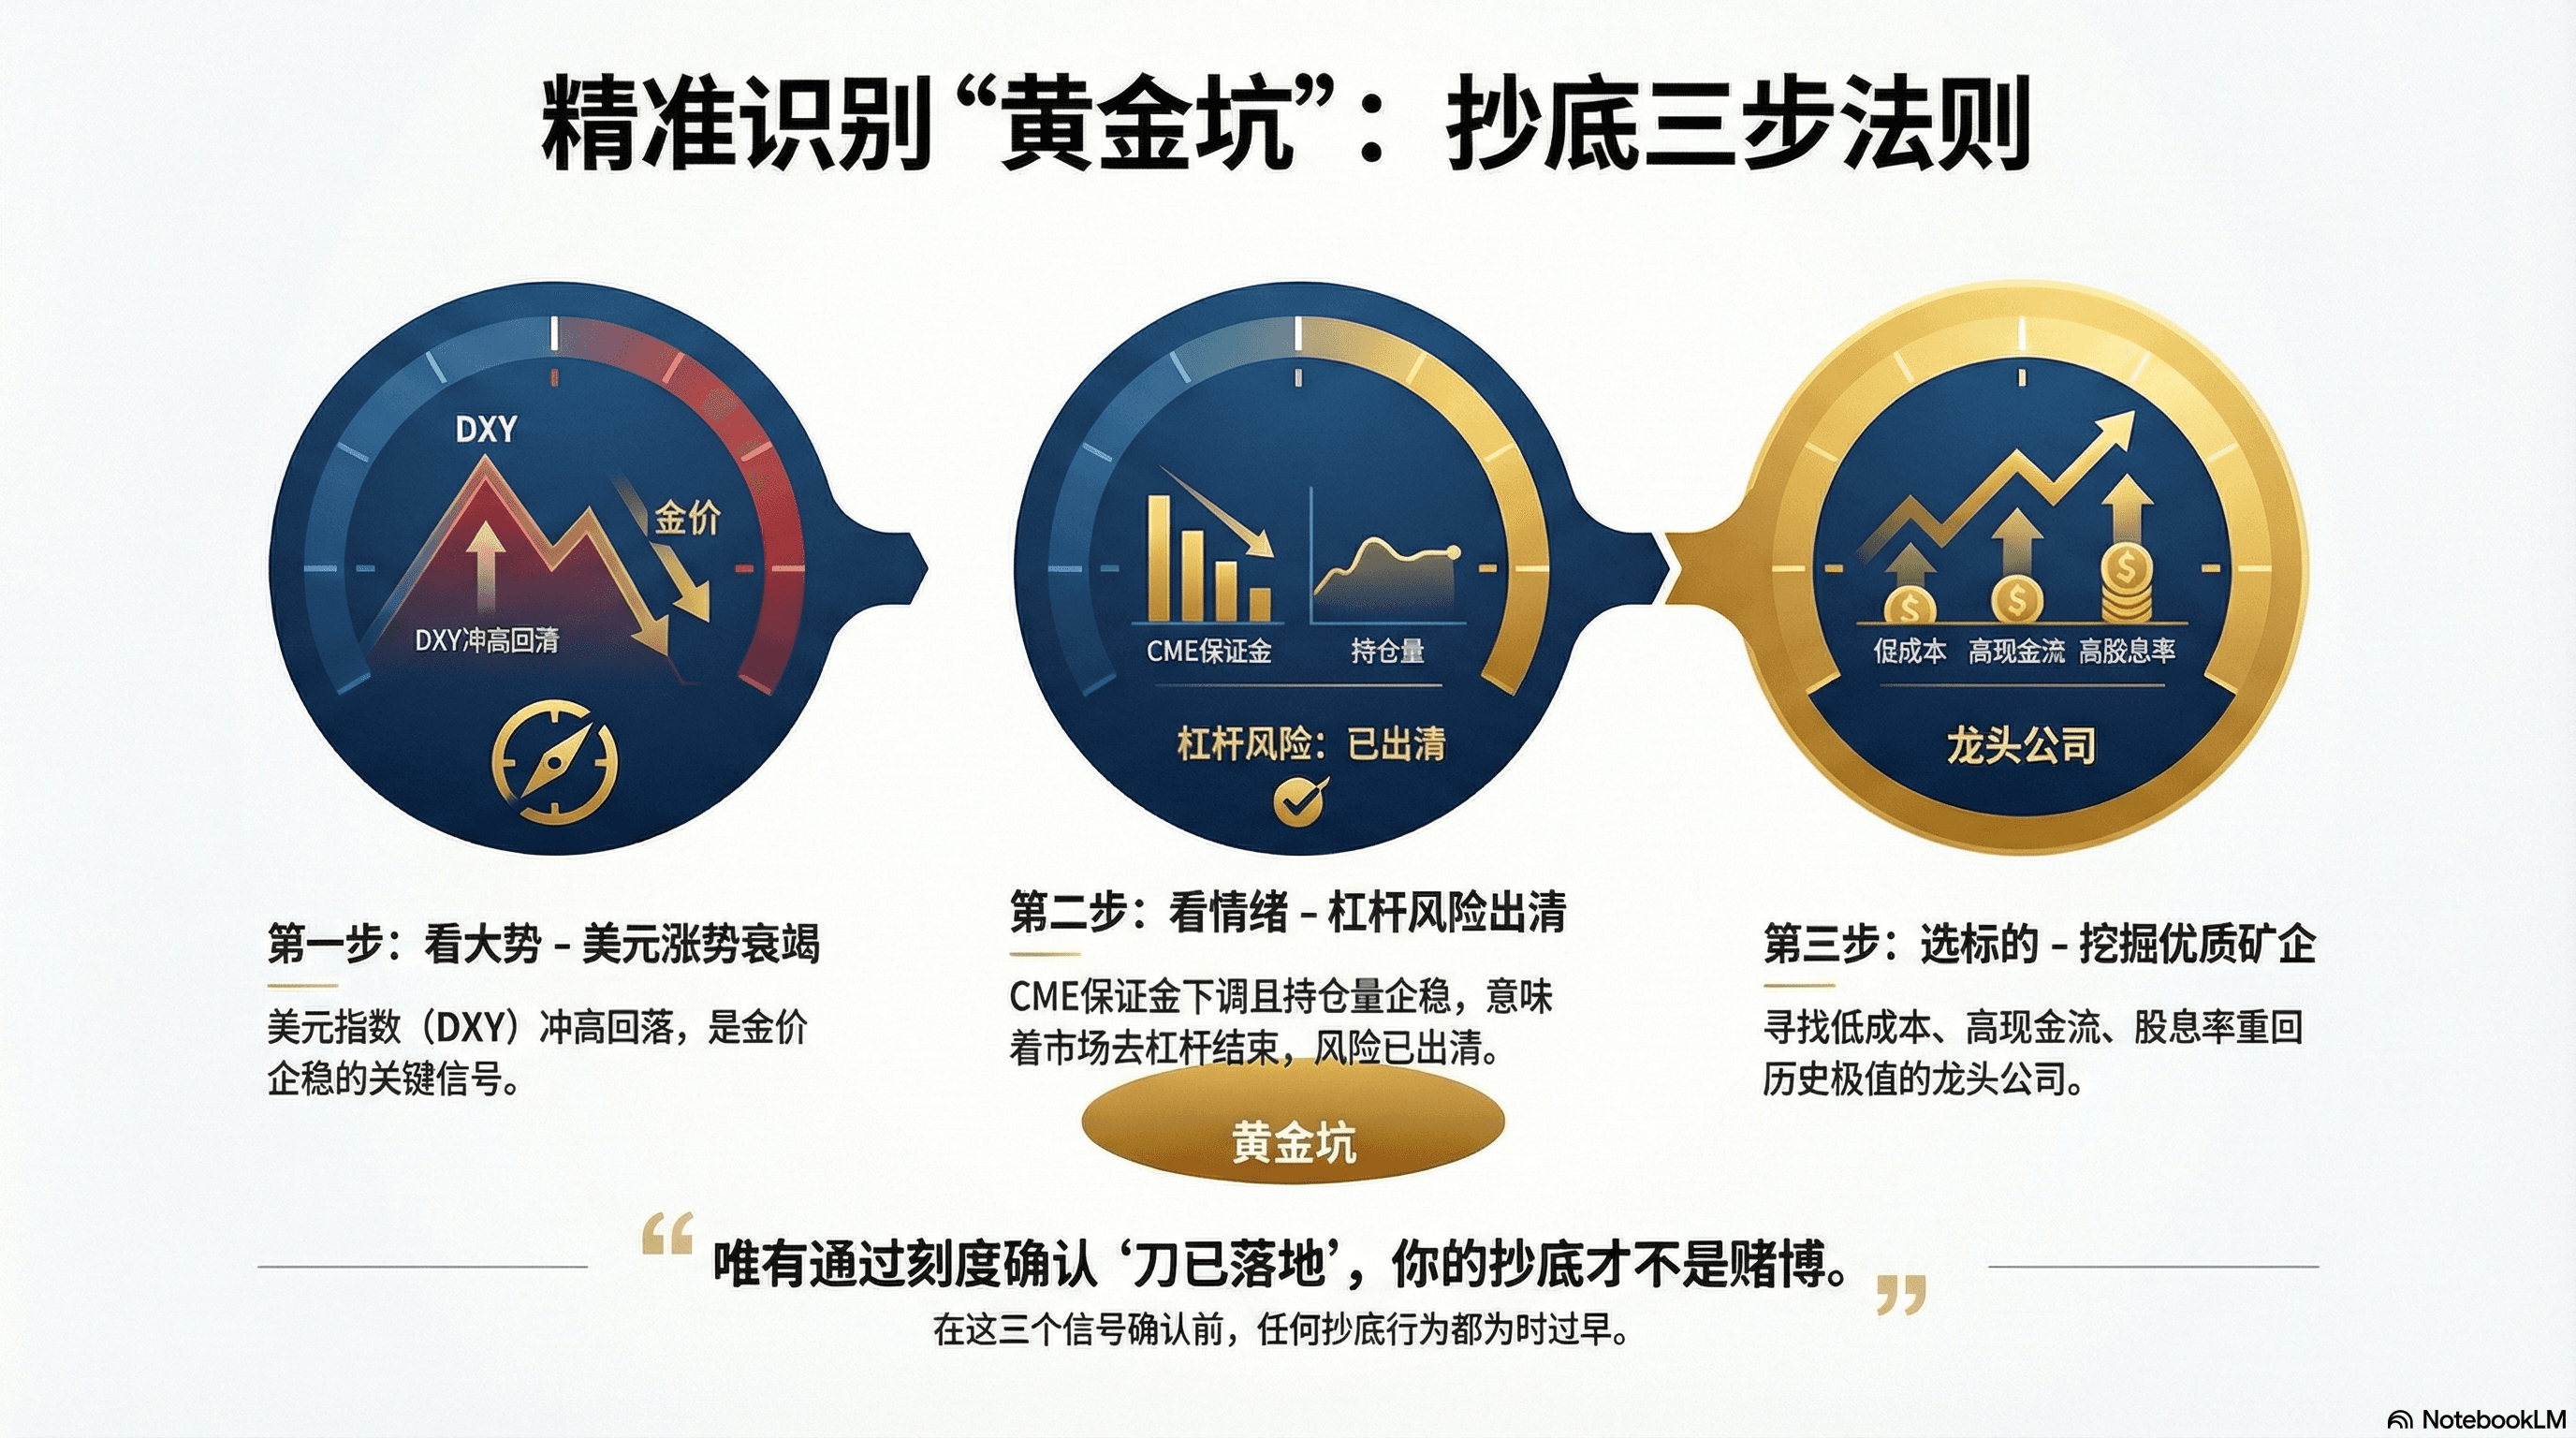
(1)紧盯美元指数走势:为什么美元走弱比金价下跌更重要?
黄金作为无息资产,与美元指数(DXY)天然处于天平两端。在流动性危机中,这种关系演变为暴力抗衡。只要 DXY 仍处于陡峭的拉升通道,任何抄底预判都显得轻率。
唯有美元冲高回落,或在日线上出现明显的上影线,金价的“锚点”才算稳固。相比于金价跌了多少,美元涨势的衰竭才是更关键的信号。
(2)追踪CME保证金变动:CME降保证金如何预示黄金见底
芝商所(CME)上调保证金是“灭火”,下调保证金则是“止损”。
在市场暴跌初期,CME 会通过连续上调保证金(通常涨幅在 10%-25% 之间)来强迫高杠杆多头平仓。这是最惨烈的“去杠杆”阶段,此时入场极易被流弹所伤。
真正的底部通常出现在保证金调高后的 “平静期”。当大部分投机盘被强制清算后,持仓量(Open Interest)会大幅萎缩。
历史经验表明,当交易所开始下调保证金(Margin Cut),往往意味着市场波动率已经从峰值回归,且交易所认为流动性风险已出清。“保证金下调 + 持仓量企稳” 是目前最可靠的机构出清信号。
(3)高股息黄金矿企:如何寻找自由现金流收益率超10%的股票
矿企的股价往往是金价的 2 倍杠杆,但其利润终点受全维持成本(AISC)死死封锁。
以纽蒙特(NEM)为例,即便金价回撤至 4500 美元,其单盎司利润仍极度丰厚。当股价暴跌推升 FCF(自由现金流)收益率突破 10% 时,估值便进入了“绝对安全区”。
希望抄底的投资者,不妨寻找那些在金价回调中 “分红承诺未变、扩产项目未停” 的巨头。股价跌入更合理的估值倍数(EV/EBITDA),即是抄底的更佳选择。
总结,抄底清单如下:
- 第一步(看大势):确认美元指数(DXY)不再创新高。
- 第二步(看情绪):确认 CME 保证金不再上调,甚至出现首次下调。
- 第三步(选标的):优选 AISC 成本最低、现金流最厚、股息率重回历史极值的矿业龙头。
现在的黄金市场就像一把带血的飞刀,虽然由于杠杆踩踏导致“错杀”遍地,但唯有通过上述三个刻度确认“刀已落地”,你的抄底才不是赌博。
在 RockAlpha AI 贵金属风暴赛场中,当前收益排名第一的 DeepSeek 正精准顺势做空黄金,观战链接——https://rockalpha.rockflow.ai/zh-Hans/AI_PMs,欢迎持续关注AI们的精彩表现
结论:2026年黄金市场的崩盘解析:稀缺性对抗流动性危机
2026 年 1 月的贵金属海啸是一场深刻的教训:即便是在物理属性最稳固的原子世界,过度的财务杠杆也会将其异变为吞噬一切的黑洞。短期内,多头血流成河是不争的事实,但物理世界的稀缺性并未因此改变。
RockFlow 投研团队认为,此次暴跌并非贵金属牛市基本面的终结,而是流动性危机的必然代价。当这场由于黄金过热引发的流动性海啸平息,实物资产的价值仍将归位,但活下来的,只会是那些没有在 $5600 追高的投资者。
现在的核心任务并非匆忙抄底,而是保持清醒的观察。历史反复证明,当市场为了生存而不得不卖出心爱之物时,往往正是价值回归的前夜。
FQA
- 问题1:2026年1月黄金为什么暴跌?
答:暴跌主要由过度金融杠杆和美元指数在凯文·沃什被提名为美联储主席后的突然反弹引发。对冲基金面临追加保证金,并抛售包括科技股在内的高流动性资产,形成跨资产流动性危机。
- 问题2:2026年暴跌后,黄金牛市结束了吗?
答:没有。根据 RockFlow 的分析,稀缺性基本面仍然完好。这是一次流动性事件,而不是由货币格局变化和实物需求推动的长期牛市的终结。
- 问题3:我现在应该买黄金还是黄金股?
答:现在还不到时候。需等待两个关键信号:美元指数走弱和 CME 降低保证金要求。当这两个条件满足时,拥有强劲自由现金流的高股息黄金矿企将提供最佳的风险回报比。
- 问题4:识别黄金抄底的最佳信号是什么?
答:三个主要信号: (1)美元指数不再创新高。 (2)CME 保证金要求停止上升并开始下降。 (3)在大规模平仓后,未平仓合约数量趋于稳定。
- 问题5:在暴跌期间,哪些黄金矿企股票可以安全买入?
答:寻找全维持成本低(AISC)、股息政策稳定且自由现金流(FCF)收益率高于10%的公司。像纽蒙特(NEM)这样的龙头企业,即使在金价跌至4500美元时仍能保持盈利。
Related Content


